
You have the Google Analytics 4 account. The data is flowing, and the dashboard greets you with a wall of charts you scroll past on the way to something else. Here is the part worth knowing: underneath all of it, GA4 answers three plain questions about your website.
How do visitors find my site?
Which channels and campaigns bring people in: search, social, ads, email, or straight to your address.
GA4: AcquisitionWhat are they doing on my site?
Which pages they view, how long they stay, and the actions they take while they are there.
GA4: EngagementDid it lead to anything?
Enquiries, sign-ups and sales: the handful of actions that actually matter to the business.
GA4: Key events & revenueEverything else in GA4 is detail hanging off those three questions. Learn to answer them and you can read almost any report without getting lost.
How GA4 records it all
Before the questions, one picture. Everything a visitor does, GA4 stores as an event. A page view is an event. A click is an event. A form submit or a purchase is an event. Each event can carry parameters, the context that makes it useful. Get this one diagram and the interface stops looking random.
A visitor
does something
views a page, clicks, submits a form, buys
GA4 records
an event
with parameters attached
Your report shows
a number
a count, or a rate built from counts
page_view→Views, and part of a sessiongenerate_lead→A key event (a conversion)purchase + value→RevenueThe whole tool in one line: visitors trigger events, events carry parameters, and every report is just counts and rates built on top of those events.
The older Universal Analytics was built around the pageview, with events bolted on. GA4 flips that: the pageview is now just one event among many, which is why the same machinery can measure pages, scrolls, downloads and purchases side by side.
Answering the three questions
How do visitors find my site?
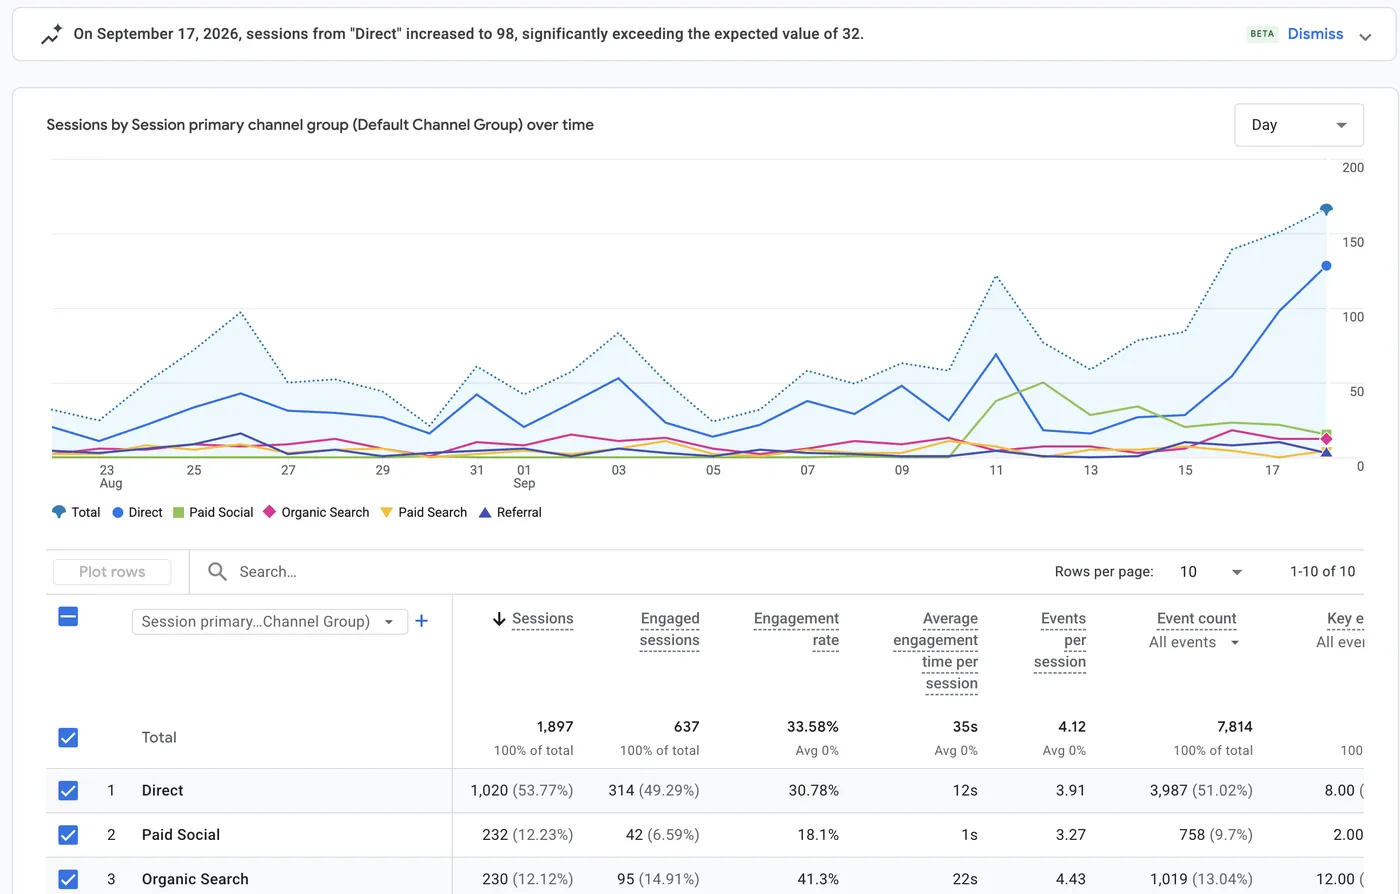
This is the Acquisition area. GA4 sorts arrivals into channels: organic search, paid, social, direct, referral, email. It also shows the specific source (say, google) and the campaign, if your links are tagged. Read this to see which channels actually bring people, not just the ones you spend the most time on.
What pages are visitors viewing?
This lives in the Engagement area, under Pages and screens. The number to read is Views. Look for two things: which pages pull the most views, and which of those actually lead to a key event. A blog post with thousands of views and no enquiries is telling you something useful.
What else are they doing?
Same Engagement area, now the events beyond page views: scrolls, clicks, video plays, form starts. The ones you care about you promote to key events, and those become the scoreboard for the third question, did it lead to anything.
The few numbers worth reading
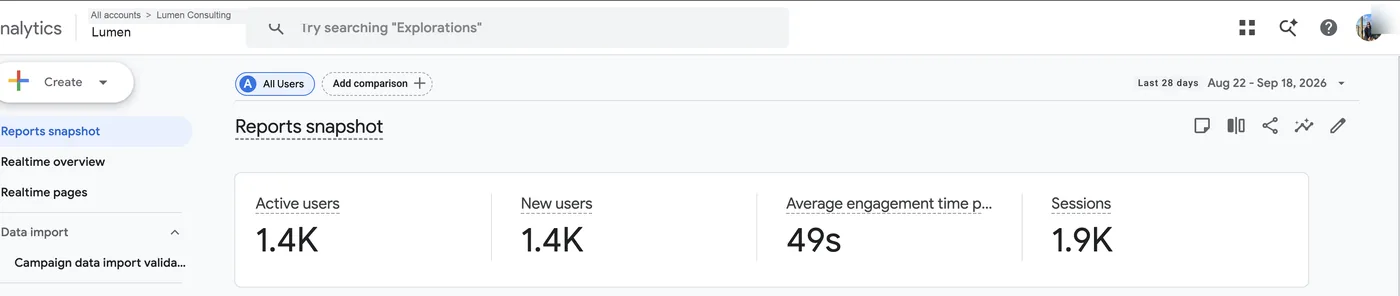
GA4 exposes hundreds of measures. You need about five, and the trick is knowing what each one counts. Hover any underlined term for a quick definition.
- Users: how many distinct people visited.
- Sessions: how many visits they made. Always higher than users, because people come back.
- Engaged sessions: the visits that were real, not an instant bounce.
- Key events: the outcomes that matter, counted every time they happen.
- Engagement rate: the share of visits that stuck around.
Notice the question hiding in those definitions: per user, or per session? The same activity divided by users gives one number, divided by sessions gives another. Always know which denominator a rate uses before comparing it to anything.
Half of reading GA4 well is knowing whether a number is counted per user, per session, or per event.
Three things beginners misread
1. Sessions are not users
They are not interchangeable. Sessions will almost always be the larger number, because one person comes back more than once. If someone says "we had 4,000 visitors", check whether they mean users (people) or sessions (visits). Reporting one as the other is the most common honest mistake in this tool.
2. A conversion is now a "key event", counted every time
The word "conversion" was renamed to key event. The naming matters less than the counting: key events are tallied every time they happen, not capped at one per visit. If a visitor submits two forms in one session, that is two key events. So key events can exceed sessions, which surprises people expecting one-per-visit. Choosing which actions deserve this status is covered in how to choose your GA4 key events.
3. Blank rows are honesty, not bugs
You will meet placeholder rows. (not set) means GA4 simply had no value for that field. (direct) in the source column means it could not tell where the visit came from, often a typed URL, a bookmark, or stripped tracking. GA4 may also hide rows when a report covers very few people (a data threshold), or show an estimate from a sample on huge queries. None of these are errors; treat them as a prompt to check your setup, not a reason to distrust the report.
Cheat sheet
| Metric | What it is | How it is counted |
|---|---|---|
| Users | Distinct people (devices) who triggered an event | One count per distinct device in the range |
| Sessions | Visits, grouped events ending after 30 min idle | One count per visit; many per user |
| Engaged sessions | Sessions that were "real" visits | Session lasting 10s+, OR 2+ views, OR a key event |
| Key events | Actions you flagged as important (old "conversions") | Counted per event instance, not per session |
| Engagement rate | Share of visits that were engaged | Engaged sessions ÷ sessions |
| Conversion rate | Share that completed a key event | Converting users ÷ users (or sessions ÷ sessions) |
If you want a sibling source that pairs naturally with GA4 for organic traffic, search query data lives in a different tool. Our Google Search Console for beginners guide covers the half of the picture GA4 does not show.
In Clearly
Connecting a GA4 property in Clearly turns these definitions into a live report. You authorize the property once, pick a date range, and the standard building blocks fill in: a headline scorecard row, channel and engagement breakdowns, and trend charts. The metrics keep the meanings above, so engagement rate stays engaged sessions ÷ sessions and key events stay per instance. Nothing is silently redefined.
The key events you flagged in GA4 surface as headline scorecards, so the actions that matter sit at the top instead of buried in a menu. Acquisition becomes a channel breakdown, engagement becomes its own panel, and the whole thing is shareable with a client by link. You read the report; you do not assemble it.
Where to go next
You now have the three questions (how they find you, what they do, whether it paid off), the one picture that explains the data (everything is an event), and the five numbers that answer most of it, each with a real definition rather than a vibe. Open your own GA4 account and read just those five, for one date range, asking the three questions as you go. Then decide which actions deserve to be key events, and pull in Search Console for the organic search side. That is a complete beginner's reading of analytics, and it is enough to brief a client without bluffing.
The series
All nine Platform 101s, in setup order
What each platform does, what it costs, how to set it up, and what its numbers mean.